
The 262,000-Dwelling Shortfall and Where It Bites Hardest
ADS Team
Author
July 28, 2026
about 2 months ago
163
views
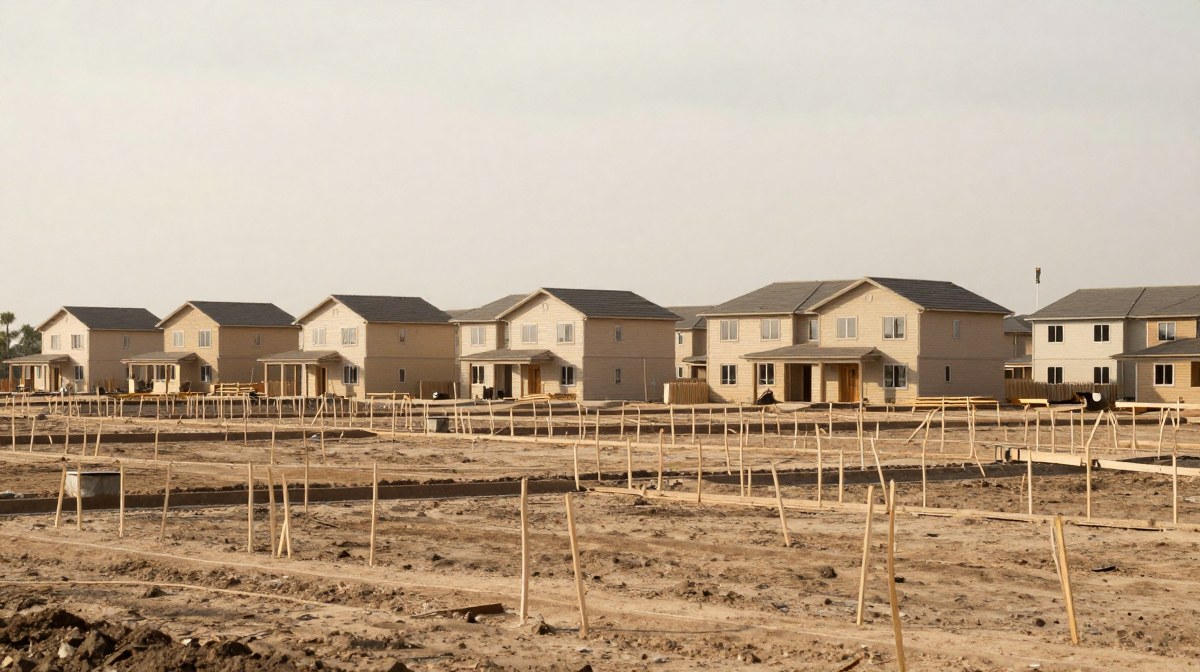
In short: Australia is projected to build about 262,000 fewer dwellings than the 1.2 million Housing Accord target over the five years to June 2029 - roughly 938,000 against 1.2 million (NHSAC). A shortfall of that size does not spread evenly — it concentrates where population growth is fastest and where planning, labour and finance constraints bind hardest, which means outer growth corridors and the middle ring of the largest capitals.
Key takeaways
- The shortfall is a flow problem: completions are running behind household formation, and the gap compounds each year.
- Construction finance is itself a constraint — higher rates raise feasibility hurdles and stall projects.
- Supply shortfalls support both prices and rents, which is why affordability pressure appears in both at once.
- Buyers in undersupplied corridors face competition; investors face low vacancy but also rising build costs.
Why is the gap opening?
Four constraints are binding simultaneously:
- Finance. With the cash rate at 4.35%, development feasibility calculations that worked at lower rates no longer clear their hurdle, so projects are shelved rather than started.
- Construction costs and capacity. Materials and labour costs have reset higher, and insolvencies among builders have removed capacity from the market.
- Planning throughput. Approval timeframes and infrastructure sequencing limit how quickly zoned land becomes completed dwellings.
- Household formation. Smaller average household size means more dwellings are needed per head of population than a generation ago.
What does it mean for a borrower?
Undersupply supports prices, which cuts in two directions depending on which side of the transaction you are on:
| Situation | Effect |
|---|---|
| Saving a deposit | Target keeps moving; prices may rise faster than you save |
| Already own | Equity supported, which can help you refinance below 80% LVR |
| Renting while saving | Squeezed from both directions — rising rents slow deposit accumulation |
| Investing | Low vacancy supports rents, but build costs and finance costs are elevated |
This is the mechanism behind the standard advice that in an undersupplied market the cost of waiting can exceed the cost of an LMI premium.
Where does it concentrate?
Shortfalls concentrate where demand growth is fastest relative to completions — typically the outer growth corridors of Melbourne, Sydney, Brisbane and Perth, and the middle ring where land supply is fixed.
Regional centres within commuting distance of a capital have absorbed spillover demand, which is why commuter-belt markets have seen both price and rent pressure despite being outside the metropolitan boundary.
For a specific location, the practical test is to compare dwelling approvals in the SA2 against population growth in the same area. Where approvals are running well behind, pressure is likely to persist.
Frequently asked questions
Will building more houses lower prices?
Sustained supply above demand reduces price pressure, but the effect is slow — a dwelling approved today may complete in two to three years. Supply is a medium-term lever, not a short-term one.
Do government schemes help with a supply shortfall?
Demand-side measures such as deposit guarantees improve access for individual buyers but do not add dwellings, and can add to competition for the same stock. Supply-side measures address the shortfall directly but act with a longer lag.
Should I buy in a corridor with heavy approvals?
Heavy approvals mean you will compete with new stock when you sell, which can restrain growth. It also usually means lower entry prices and modern housing. It is a trade-off between entry price and future competition rather than a simple good or bad signal.
Related reading
- Lump Sum vs Extra Repayments: Which Saves More?
- The Borrowing Power Formula: Income, HEM, Buffers and Debts
- Financial Hardship: Your Rights Before You Miss a Payment
Sources
- State of the Housing System report — National Housing Supply and Affordability Council
- Building activity and approvals — Australian Bureau of Statistics
Information current as at 2 September 2026.
General advice warning: This article contains general information only. It does not take into account your objectives, financial situation or needs, and it is not personal credit or financial advice. Consider whether it is appropriate for you and seek advice from a licensed credit representative before acting.
Any interest rate shown is an example only and is not an offer of credit. Where a rate is quoted, the applicable comparison rate is available from the relevant lender and should be considered alongside it.
Related Posts

How to Read ABS Population Data Like an Analyst
The ABS publishes Estimated Resident Population by SA2 annually and free of charge, which is the same data behind most "fastest growing suburb" headlines. The main trap is percentage growth from a...
Infrastructure-Led Growth: Reading the Signals
Infrastructure moves property values when it changes accessibility, and only when it is actually delivered. The distinction that matters is between a funded, dated project and an announcement - mar...
Growth Corridors vs Middle Ring: Two Investment Theses
Growth corridors and middle-ring suburbs are opposite bets. Corridors offer low entry prices and strong rental demand but abundant land supply that restrains capital growth. Middle-ring suburbs hav...
Need Financial Assistance?
Connect with our network of trusted finance providers to find the right loan solution for your needs.